AI Workflows For Finance, Simplified
Explore the open-source demo to see AI in action for financial research and analysis. We help funds turn custom data into insights.
From demo to deployment: your AI, your way
Explore the Demo with Public Data
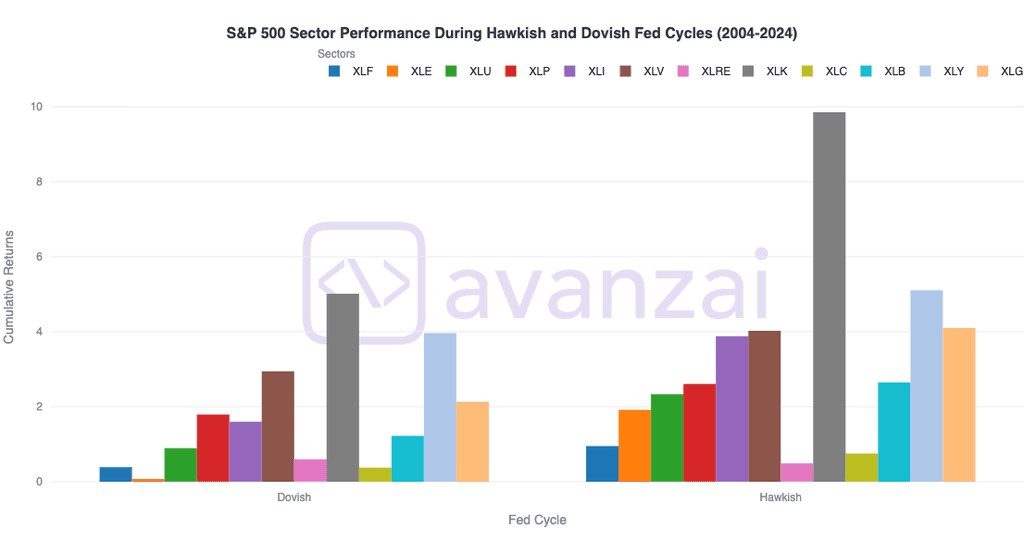
Start with our open-source tool to chart market trends, asset performance, and risk metrics using public datasets. Download visualizations or raw data to use in decks, dashboards, or reports—no setup required.
Upgrade with Custom Data Integrations
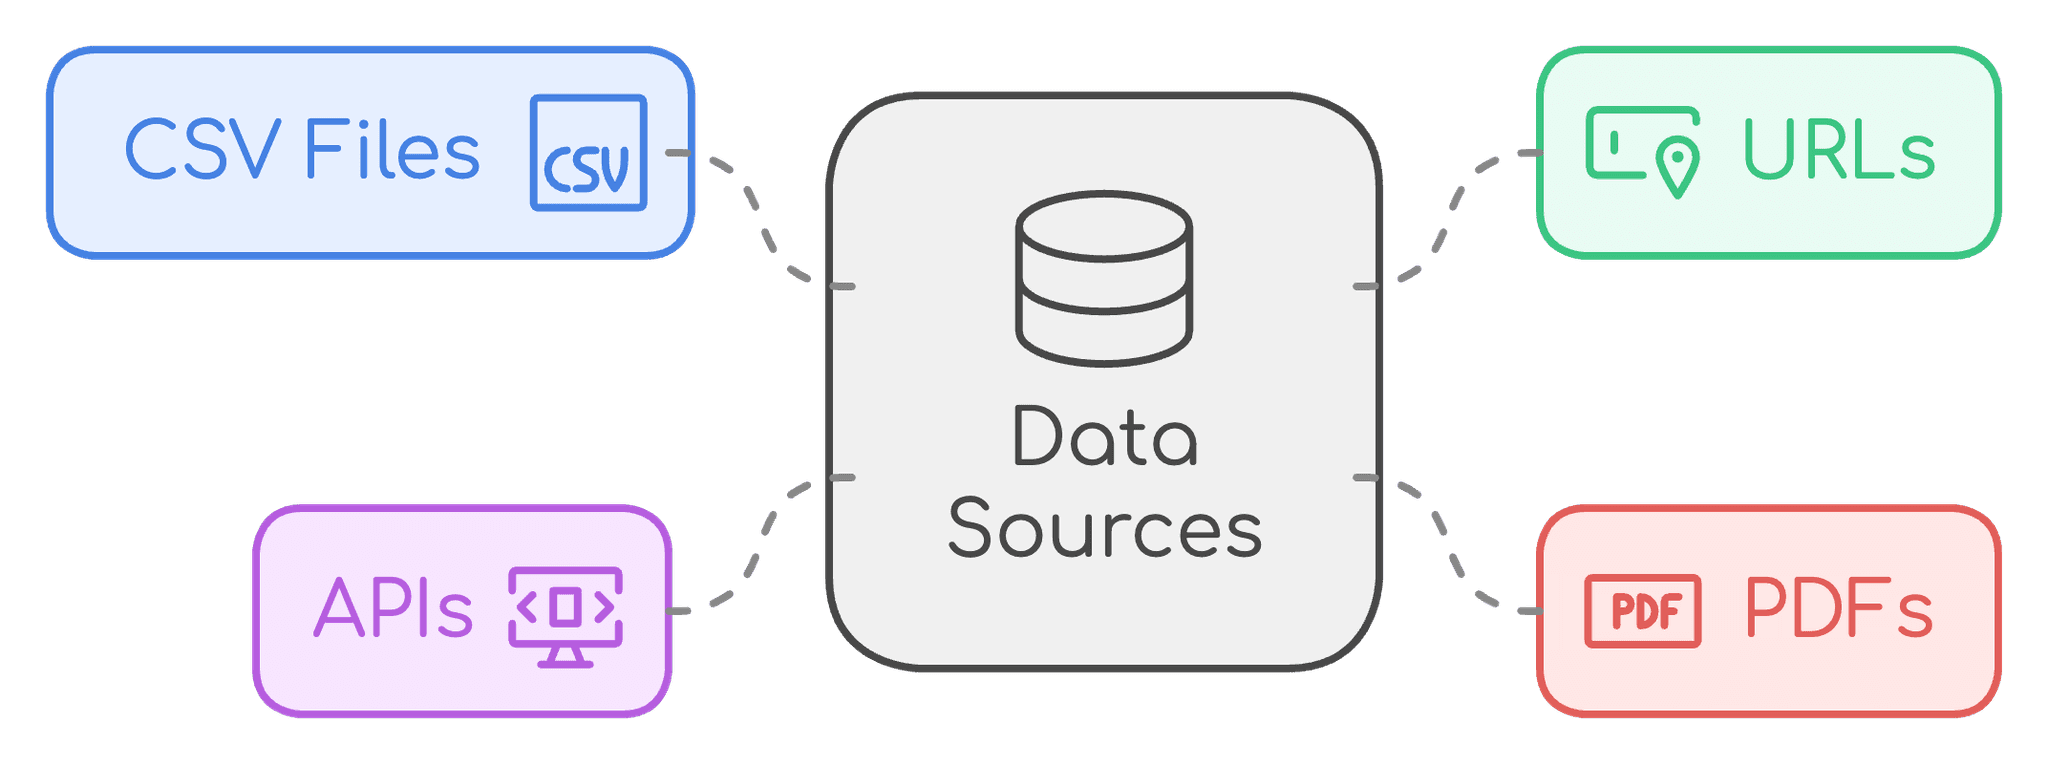
Want more data or connect your reference data, market data, etc? Institutions can use our Python SDK or agent builder to connect their own data pipelines to their agents
Macro Analysis
Chart relationships and shifting dynamics between thousands of assets spanning the Russell 1000, major indices, ETFs, commodities, currencies, and crypto to identify regime shifts
Instrument Screening
and Ranking
Filter and rank assets using customizable technical and fundamental criteria to surface the most promising opportunities.
Risk Analytics &
Factor Modeling
Measure cross-asset risks through stress testing and scenario analysis while building validated multi-factor models with automated feature selection and risk decomposition.


